Demand vs Supply
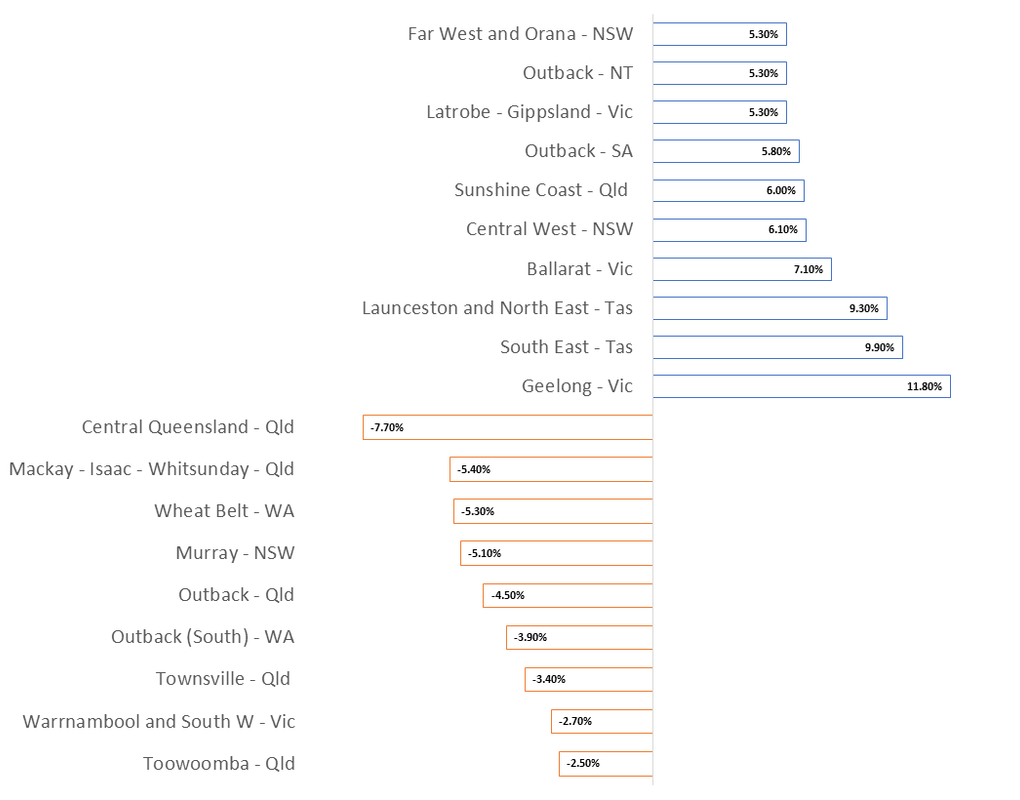
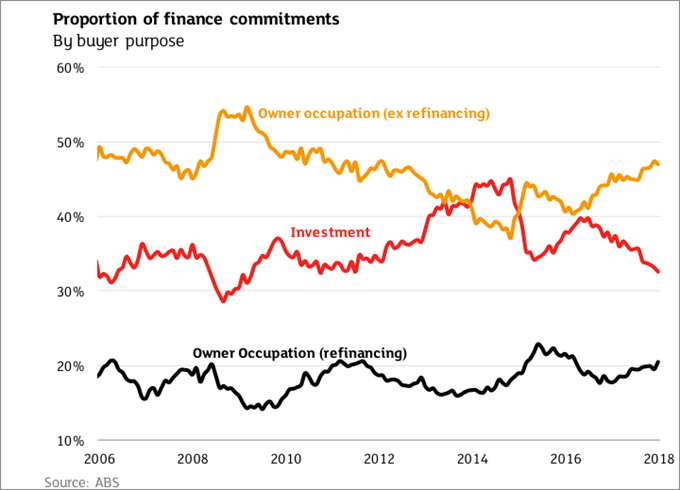
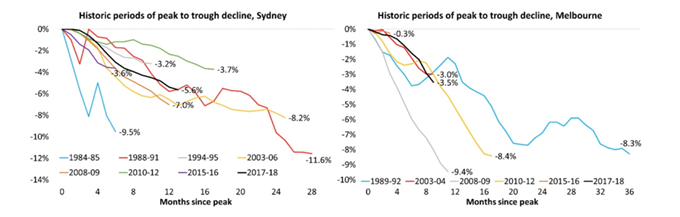
The current market situation provides prospective buyers with something they haven’t experienced in a little while - CHOICE. This has arisen due to a reversal in the supply/demand equation that drove strong price gains over recent years. The number of properties for sale has increased, considerably, from the record lows of previous years: an undersupply that promoted a rise in property values. Homeowners wanting to capitalise on the strong value growth have led the charge of listings, keen to upgrade or downsize or secure new homes and apartments reaching completion. This increase in listings comes at a time when demand, particularly from investors, has begun to soften. This change in supply and demand has led to a decline in property values over the past 12 months. However, the demand has not dropped off from all buyer types and prices haven’t declined in every city, suburb or regional centre. And where property prices are softening, values are still considerably higher than they were three to five years ago in many cities and areas. What are property values doing? If we look at CoreLogic data, we can see that there are many variations in the size of price rises and falls across the country and it is highly dependent on the strength of the local economy and the supply/demand balance in the area. At a national level, dwelling values have declined by -2.0% over the past year. But this is not a blanket trend: property values in capital cities have declined by -2.9% while, positively, the combined value of regional centres grew by 1.6%. Variations in value changes also exist at the capital city level with Sydney values declining -5.6%, Melbourne -1.7% while Brisbane values rose 0.9%, Adelaide increased 1.0% and Canberra is up 2.3%. Variations even exist between suburbs separated by a 20-minute car trip. If we look at Melbourne, as an example, its values dropped by -1.7% overall, but drilling into regions across the city shows Melbourne West values increased by 3.1% and the North West by 3.0%. Conversely, Melbourne’s Inner East declined by -6.1%. So, it’s important to understand the dynamics and drivers of supply and demand at a local level. 12 Month change in dwelling values Top and bottom capital city sub-regions 12 Month change in dwelling values Top and bottom regional sub-regions Why have prices begun to fall? In short, the demand supply equation has switched from where it was sitting at the beginning of 2017. Demand Overall, demand is lower. Securing finance for home and investment purchases has become tougher because of the tightening of lending restrictions by banking regulators. Additionally, many lenders have taken it on themselves to change their policies against the backdrop of the Banking Royal Commission. Bank funding costs have also risen over the past 6 to 12 months and this has prompted lenders - especially smaller and medium sized lenders – to increase interest rates. These changes have influenced a 5% decline in the total value of housing finance commitments over the past 12 months, as reported by the ABS. But if we take a micro view of the numbers, the decline can largely be attributed to one group; investors. Investor numbers grew faster than any other buyer type in the recent property upcycle. Consequently, lending restrictions came into effect to slow investor enthusiasm and subsequently led to a 15% drop in activity from this buyer segment. ABS finance data also shows that owner occupier demand - from upsizers and downsizers - has only declined by 2.3% over the past year. First Home Buyer (FHB) have seized the opportunity of moderating prices and a smaller pool of investors, with the number of dwelling financed by FHB’s up 6.6% over the past year. Supply As mentioned earlier, listing volumes have risen from a historically low base of previous years to above average levels in the last 12 months. With the spring selling season here, home owners have assessed the current market and looked to place their property on the market to realise capital gains or to benefit from moderating prices to upsize or downsize. In capital cities, listings are now 9.4% higher than they were 12 months ago. The Greater Sydney marketplace has absorbed the largest price decline: supply has influenced this outcome, with listing volumes 22.5% higher than this time last year. Cranes still dot the skylines of many suburbs, but a wave of developments have been completed with the new apartments either being occupied or relisted by investors looking to capitalise on the price growth made during the construction process (or by those investors that have struggled to obtain finance). This supply of new dwellings has also contributed to the growing number of listings over the past six months. Should we be worried about this price decline? The Head of Research at CoreLogic, Tim Lawless, recently released a report that put the current downturn – minus the media hype – in perspective against previous corrections. He said: “Australia’s largest housing market, Sydney, has seen values fall by 5.6% since peaking in July last year; a trajectory that is straight down the middle of previous downturns. During the GFC, Sydney dwelling values fell by 7.0% in the space of twelve months, and the downturn before that (2003-2006) saw values fall 7.1% over the same number of months”. “Australia’s second largest city, Melbourne, has seen values falling since November last year. Since that time the market is down a cumulative 3.5% and the descent has generally been milder relative to previous downturns”. Source: CoreLogic The current property market condition, indicators and media reports provide us with a timely reminder that buyers, renters, owner occupiers, investors and first home buyers should always ensure that comprehensive research and due diligence is done at the local market level. Demand vs Supply
Market offers choice after years of undersupply